As solar energy becomes more readily available and popular, more and more householders are using solar power to reduce their carbon footprint and save money on their monthly electricity bills. But how much will you save on your electric bill by installing solar panels?
The exact bill saving depends:
- Location
- Size of the home solar system
- Consuming electricity
- Sunshine hours
Combining the above conventional factors with the latest relevant data given by the EIA, we have roughly estimated the amount of electricity that can be saved in each state, and it has been proven that solar panel installation can save homeowners a lot of money on their electricity bills in the long run.
Come and see what is the average monthly electric bill with solar panels in your state!
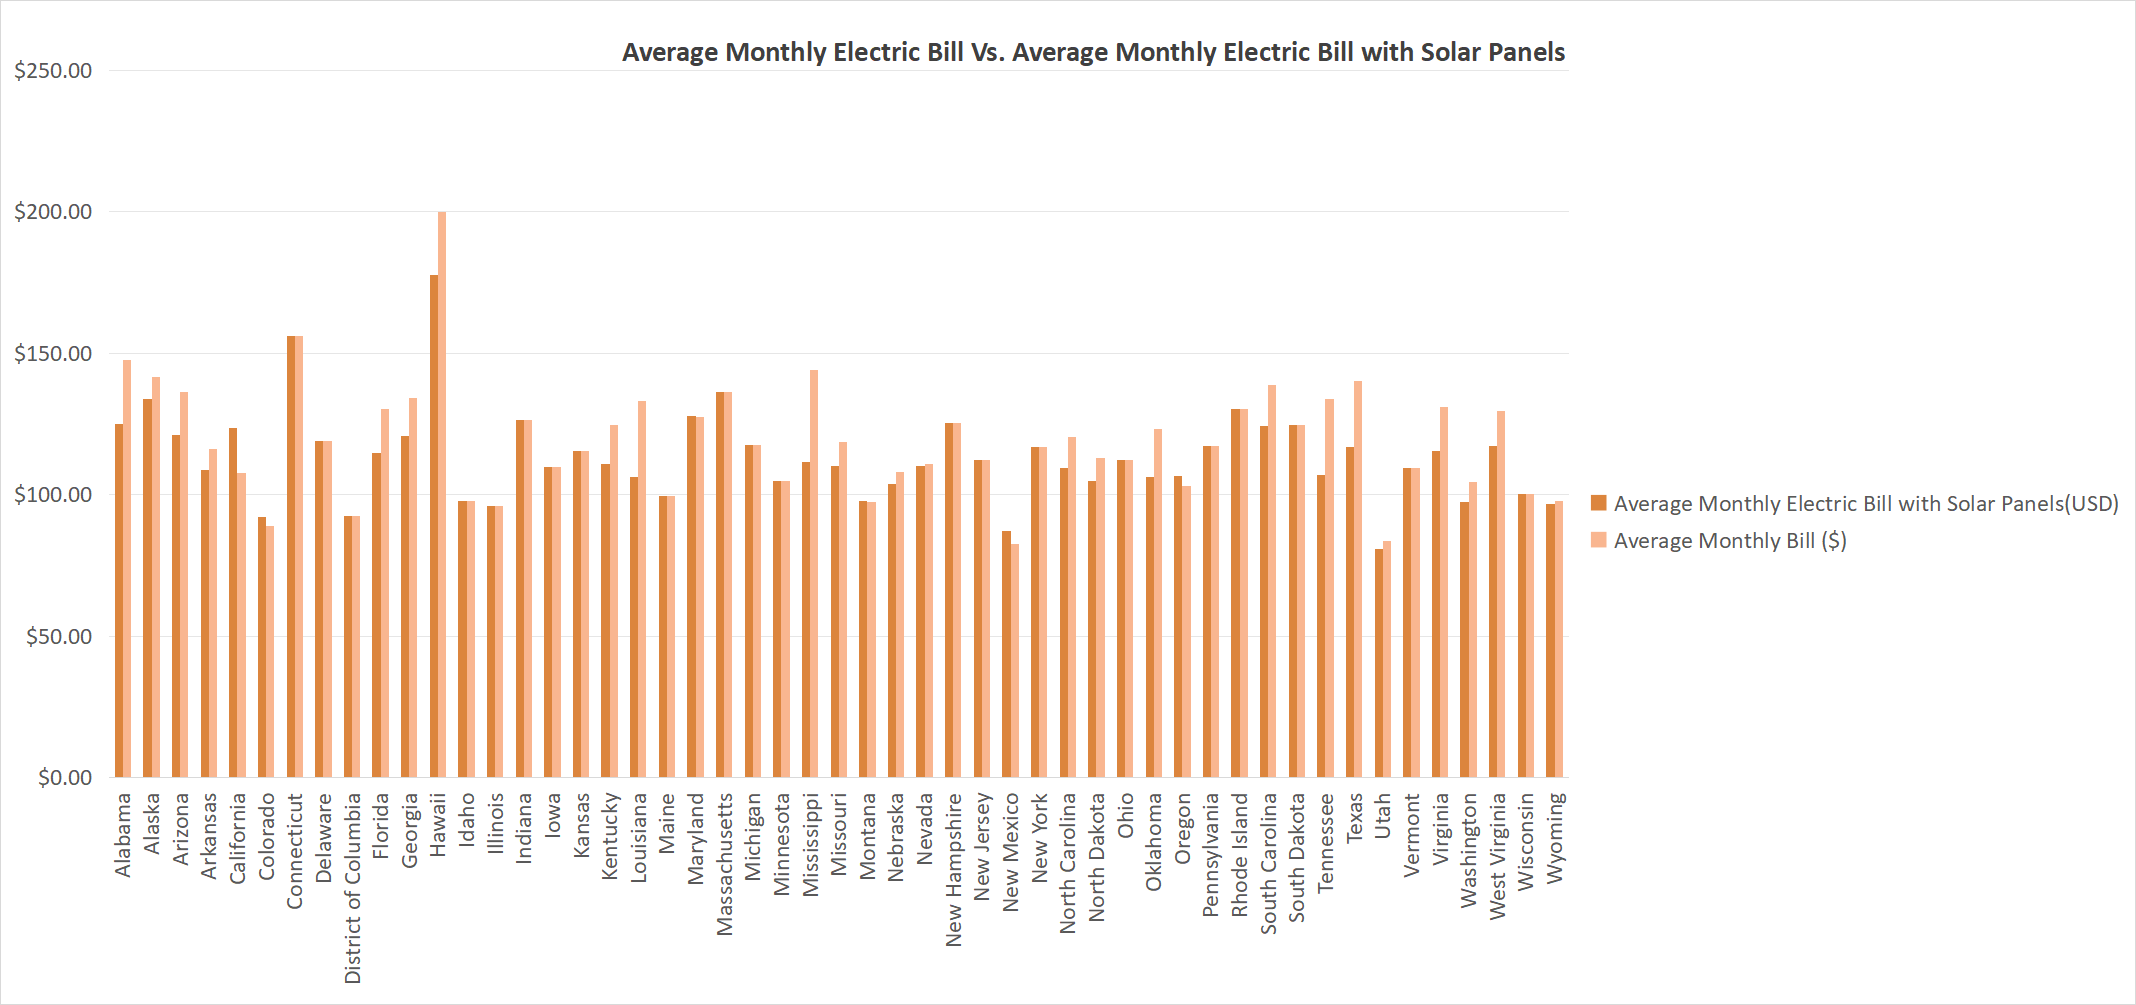
What Is The Average Monthly Electric Bill with Solar Panels in The US?
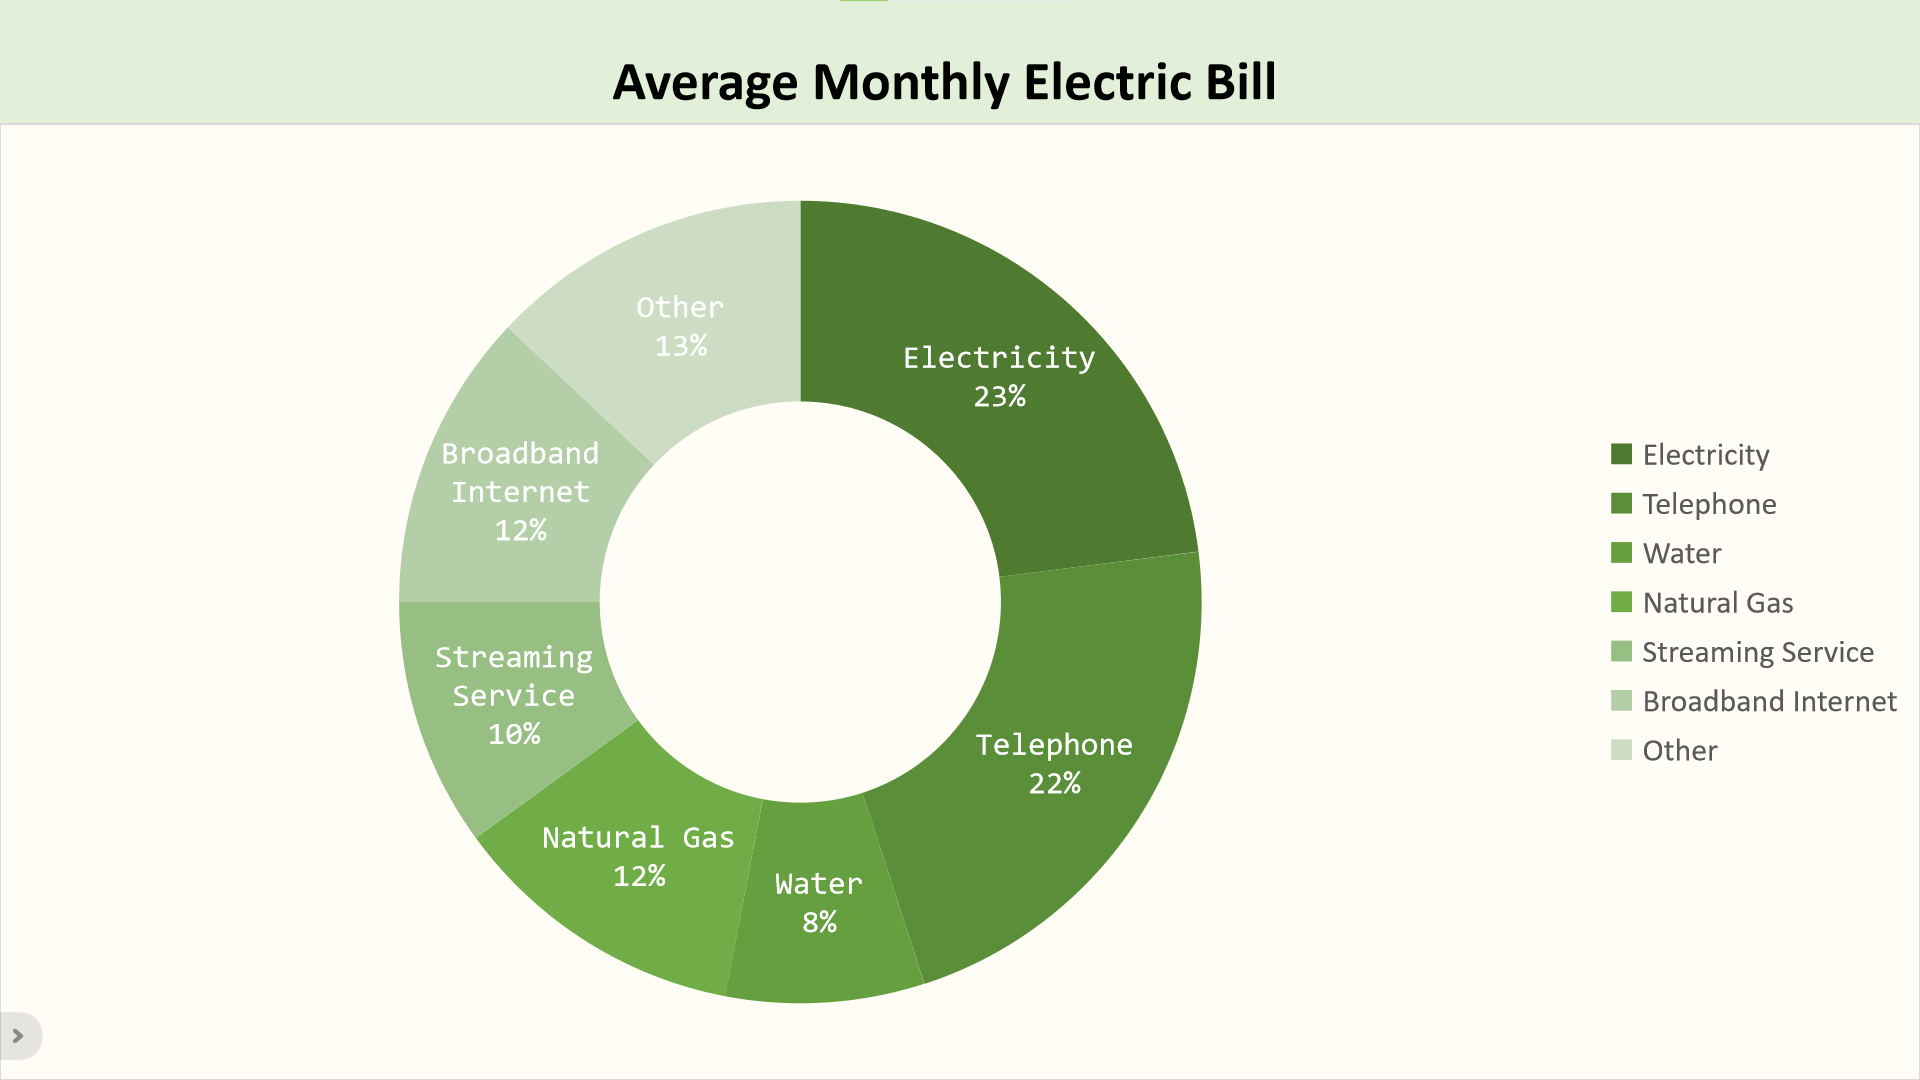
How much do solar panels save per month vary from one state to another, and so do the other utility costs like water, natural gas, streaming services, phone, broadband Internet, and more. As of 2023, the average electricity bill in the US is nearly $117.46, whereas the total cost equals $538-613 per month.
The average electricity bill in the U.S. is projected to drop slightly in 2024, from $117.46 per month in 2023 to $116.50 per month. This is due to a decrease in electricity demand and an increase in renewable energy sources
How Much Is the Average Monthly Electric Bill with Solar Panelsl?
According to the U.S. Energy Information Administration (EIA), the average monthly electric bill for U.S. residential customers in 2022 was $137, with an average monthly consumption per customer of 907 kWh. This is a 5% increase in real terms from 2021, mainly due to higher electricity prices and more extreme temperatures.
How much do solar panels save per month varies by state, depending on factors such as electricity prices, consumption patterns, weather, and household characteristics.
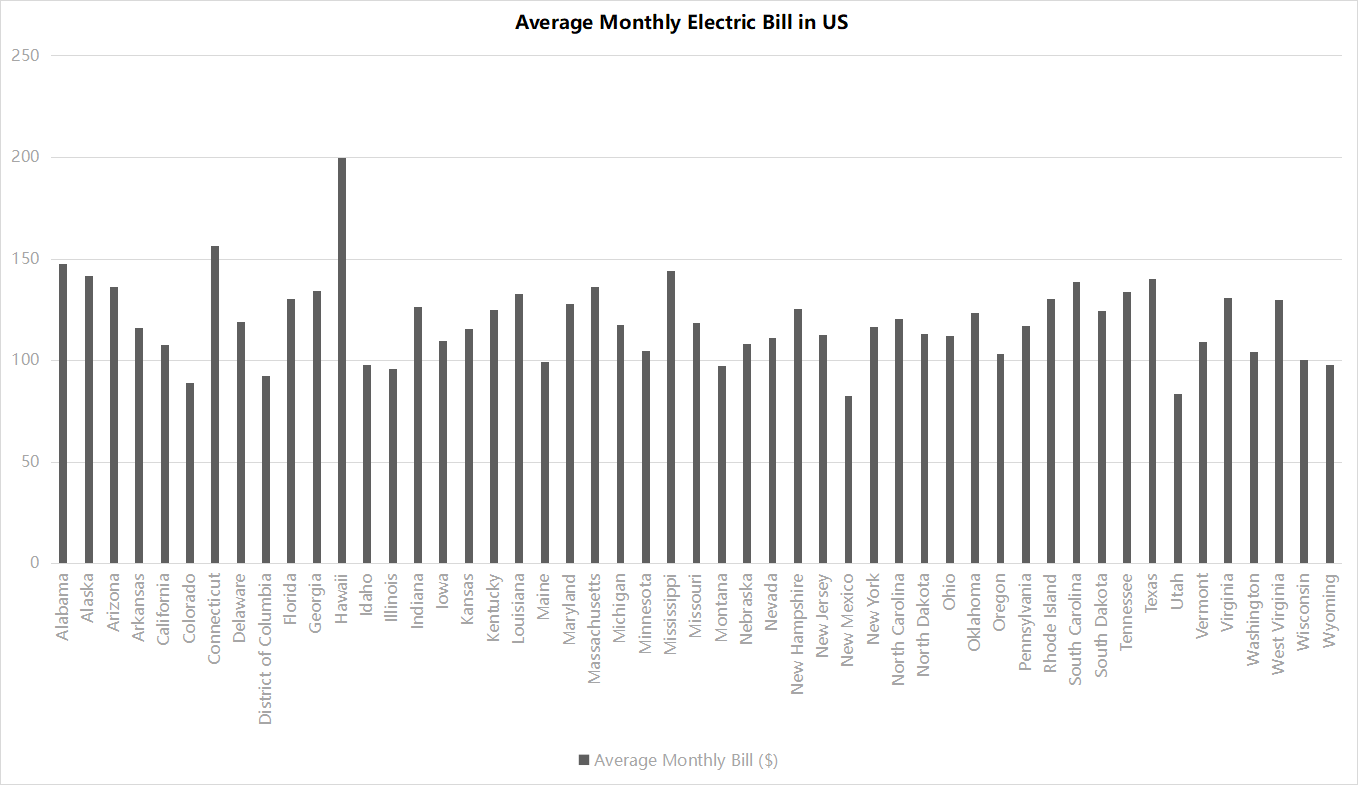
The state with the highest average electric bill in 2024 was Hawaii ($200), followed by Connecticut ($156.21) and Alabama ($147.75). The state with the lowest average electric bill was New Mexico ($82.72), followed by Utah ($83.71) and Colorado ($88.95)
The amount of electricity generated by solar panels is directly related to the amount of direct sunlight in your area. This is the peak hours of sunlight in your area and reflects the average number of hours of sunlight per day. The longer the hours of sunlight, the more electricity your solar energy panels will generate, and solar panels in areas with 5 hours of sunlight will collect much more energy than panels with 3 hours of sunlight. The efficiency of solar panels is also affected by temperature, and poor heat dissipation can lead to a loss of efficiency, so it’s not true that solar panels are more efficient in warmer areas.
| State | Average Monthly Bill ($) |
|---|---|
| Alabama | 147.75 |
| Alaska | 141.43 |
| Arizona | 136.23 |
| Arkansas | 116.16 |
| California | 107.64 |
| Colorado | 88.95 |
| Connecticut | 156.21 |
| Delaware | 118.85 |
| District of Columbia | 92.42 |
| Florida | 130.40 |
| Georgia | 134.11 |
| Hawaii | 200.00 |
| Idaho | 97.77 |
| Illinois | 95.86 |
| Indiana | 126.51 |
| Iowa | 109.63 |
| Kansas | 115.53 |
| Kentucky | 124.67 |
| Louisiana | 132.96 |
| Maine | 99.44 |
| Maryland | 127.62 |
| Massachusetts | 136.37 |
| Michigan | 117.57 |
| Minnesota | 104.76 |
| Mississippi | 144.02 |
| Missouri | 118.55 |
| Montana | 97.27 |
| Nebraska | 108.09 |
| Nevada | 110.94 |
| New Hampshire | 125.24 |
| New Jersey | 112.39 |
| New Mexico | 82.72 |
| New York | 116.70 |
| North Carolina | 120.38 |
| North Dakota | 112.93 |
| Ohio | 112.21 |
| Oklahoma | 123.30 |
| Oregon | 103.01 |
| Pennsylvania | 117.11 |
| Rhode Island | 130.40 |
| South Carolina | 138.65 |
| South Dakota | 124.50 |
| Tennessee | 133.66 |
| Texas | 140.29 |
| Utah | 83.71 |
| Vermont | 109.24 |
| Virginia | 130.92 |
| Washington | 104.32 |
| West Virginia | 129.61 |
| Wisconsin | 100.18 |
| Wyoming | 97.68 |
The 5 states with the highest electricity bills in the U.S. :
- Hawaii
- South Carolina
- Texas
- Alabama
- Mississippi
The 5 states with the lowest electricity bills in the U.S.:
- New Mexico
- Utah
- Colorado
- the District of Columbia
- Illinois
How Much Can Solar Panels Save the Average Household?
According to the U.S. Energy Information Administration (EIA) SHORT-TERM ENERGY OUTLOOK, solar power to be the leading source of growth in electricity generation in both 2024 and 2025
How much does solar save per month can vary depending on the electricity rates in each state, as well as other factors like sun hours, usage, and local incentives.
Daily Energy (kWh)=Solar Array Capacity (kW)×Average Peak Sun Hours
For example,
An average home solar array produces 7.15 kW. Assuming an average of 4.5 peak hours of sun per day,
Daily Energy (kWh)=7.15kW×4.5hours=32.175kWh
Monthly Energy (kWh)=Daily Energy (kWh)×Number of Days in a Month
Assuming a month with 30 days:
Monthly Energy (kWh)=32.175 kWh/day×30 days=965.25 kWh
So, in this example:
- Daily Energy Production: 32.175 kWh
- Monthly Energy Production: 965.25 kWh
In 2023, the average electricity rate in the U.S. was $0.14 per kWh. A 7.15 kW solar array could produce more electricity than the average monthly usage of 886 kWh in the U.S., resulting in savings of $1,432 per year for the average American homeowner.
We can estimate the savings on a state-by-state basis. For states with average monthly consumption below 965 kWh, a 7.15 kW solar array would cover their electricity needs. The estimated monthly savings for these states would be equal to their average electricity bill.
To calculate the savings, we can multiply the monthly electricity consumption by the average rate of that state. For example, a typical home in Alabama with a solar panel that generates 965 kWh at a rate of 12.96 cents/kWh can save $125.06 per month:
Solar arrays with an average output of 965 kWh x $0.1296 per kWh = $125.06
Electricity Prices and Solar Savings by State:
| State | Average Price Per kWh (Cents) | Average Monthly Usage (kWh) | Average Monthly Electric Bill with Solar Panels(USD) |
|---|---|---|---|
| Alabama | 12.96 | 1,140 | $125.06 |
| Alaska | 22.55 | 594 | $133.89 |
| Arizona | 12.54 | 1,048 | $121.01 |
| Arkansas | 11.27 | 1,098 | $108.80 |
| California | 22.82 | 542 | $123.67 |
| Colorado | 13.07 | 704 | $91.96 |
| Connecticut | 21.91 | 713 | $156.21 |
| Delaware | 12.52 | 950 | $118.85 |
| District of Columbia | 13.09 | 706 | $92.42 |
| Florida | 11.90 | 1,096 | $114.84 |
| Georgia | 12.51 | 1,072 | $120.72 |
| Hawaii | 33.49 | 531 | $177.78 |
| Idaho | 10.16 | 961 | $97.62 |
| Illinois | 13.18 | 728 | $95.86 |
| Indiana | 13.37 | 946 | $126.51 |
| Iowa | 12.73 | 861 | $109.63 |
| Kansas | 12.98 | 890 | $115.53 |
| Kentucky | 11.50 | 1,084 | $110.98 |
| Louisiana | 11.02 | 1,192 | $106.34 |
| Maine | 17.02 | 584 | $99.44 |
| Maryland | 13.12 | 973 | $127.66 |
| Massachusetts | 22.89 | 596 | $136.37 |
| Michigan | 17.54 | 670 | $117.57 |
| Minnesota | 13.50 | 776 | $104.76 |
| Mississippi | 11.56 | 1,171 | $111.56 |
| Missouri | 11.41 | 1,039 | $110.11 |
| Montana | 11.22 | 872 | $97.84 |
| Nebraska | 10.75 | 1,005 | $103.74 |
| Nevada | 11.49 | 959 | $110.17 |
| New Hampshire | 19.85 | 631 | $125.24 |
| New Jersey | 16.35 | 687 | $112.39 |
| New Mexico | 13.52 | 646 | $87.31 |
| New York | 19.48 | 599 | $116.70 |
| North Carolina | 11.32 | 1,063 | $109.24 |
| North Dakota | 10.85 | 1,041 | $104.70 |
| Ohio | 12.77 | 879 | $112.21 |
| Oklahoma | 11.00 | 1,088 | $106.15 |
| Oregon | 11.37 | 936 | $106.49 |
| Pennsylvania | 13.76 | 851 | $117.11 |
| Rhode Island | 22.30 | 585 | $130.40 |
| South Carolina | 12.86 | 1,078 | $124.10 |
| South Dakota | 12.22 | 1,019 | $124.52 |
| Tennessee | 11.07 | 1,183 | $106.83 |
| Texas | 12.11 | 1,094 | $116.86 |
| Utah | 10.43 | 775 | $80.87 |
| Vermont | 19.26 | 567 | $109.24 |
| Virginia | 11.96 | 1,094 | $115.41 |
| Washington | 10.11 | 984 | $97.56 |
| West Virginia | 12.15 | 1,066 | $117.25 |
| Wisconsin | 14.52 | 690 | $100.18 |
| Wyoming | 11.17 | 867 | $96.82 |
How to Build a Home Electricity System That Saves More Money with Solar Panels
Building a home electricity system that saves more money with solar panels requires a combination of factors, including system design, energy management, and sensible electricity habits. Here are some suggestions:
System size and capacity
Determine the size and capacity of the solar panels based on the home’s energy consumption and budget. A large enough system can cover more electricity demand, thus reducing the amount of electricity purchased.
Energy Storage
Installing an energy storage system (such as a solar battery storage system) can help store excess solar energy at night or on cloudy days so that it can be used when needed. This can further reduce reliance on the grid and save money.
Smart Energy Management System
Use a smart energy management system to monitor the power generated by your solar panels as well as your home’s energy consumption. This can help you optimize your energy use and ensure that solar power is used during peak hours to minimize the cost of purchasing electricity.
Efficient Appliances and Lighting
Use energy-efficient appliances and LED lighting to reduce your home’s electricity needs. Choosing appliances that use less energy will reduce overall energy consumption and increase the percentage of solar power.
Regular Maintenance and Cleaning
Regularly check the condition of your solar panels and make sure they are kept clean. Dust, dirt or leaves can affect the efficiency of your solar panels, and timely cleaning will maintain optimal power generation.
Wise energy habits
Avoid wasting electricity by practicing sensible electricity usage habits. Turning off unnecessary lights and appliances and leaving them on standby can further reduce electricity costs.
Regular evaluation and optimization
Evaluate the performance and savings of your solar system regularly. If there are new technologies or programs available, consider upgrades to improve system efficiency and savings further.
Taking the above factors into consideration, you can develop a solar panel system and energy management plan tailored to your home’s situation to minimize electricity costs. It is best to consult a professional solar provider or energy consultant for more specific advice and customized plans.
Average Electricity Bills FAQ
Will I have an electric bill with solar panels?
Yes, even if you have solar panels installed, you may still have an electric bill, but it is likely to be significantly reduced compared to what you would have without solar panels.
How much can solar panels save per month?
A typical 5 kW residential solar system can save between $100 and $150 per month on your electric bill. Actual savings depend on a number of factors, including the size of the solar array, energy usage, and the cost of electricity in your area. Weather conditions and the orientation of the solar panels also have an impact.
What can I benefit from a property tax exemption for solar in California?
You can save money on your property tax bill by installing solar panels in California or other solar devices on your property, as they will not increase the assessed value of your property for property tax purposes until January 1, 2025.
The solar investment tax credit (ITC) is a federal policy mechanism that supports the growth of solar energy in the United States by providing a tax credit for a percentage of the cost of installing a solar system. The ITC applies to both residential and commercial solar systems, as well as energy storage devices that are paired with solar. The ITC was enacted in 2006 and has been extended and modified several times since then.
How much does a solar panel yield per month?
The solar panel output per month depends on the power rating, the peak sun hours, and the system losses. You can use this formula to estimate it:
For example, if you have a 300W solar panel in San Francisco, California, where the average peak sun hours are 5.4 per day, the solar panel output per month would be:
Solar Output (kWh/month)=300×5.4×0.75×30
Solar Output (kWh/month)=1215
This means that a 300W solar panel in San Francisco can produce about 1215 kWh of electricity per month on average.
What is the payback period for solar panels?
The average payback period for solar panels is 6 to 10 years.m. It depends on the system size, location, incentives, electricity savings, and so on.